卷积神经网络梯度可视化
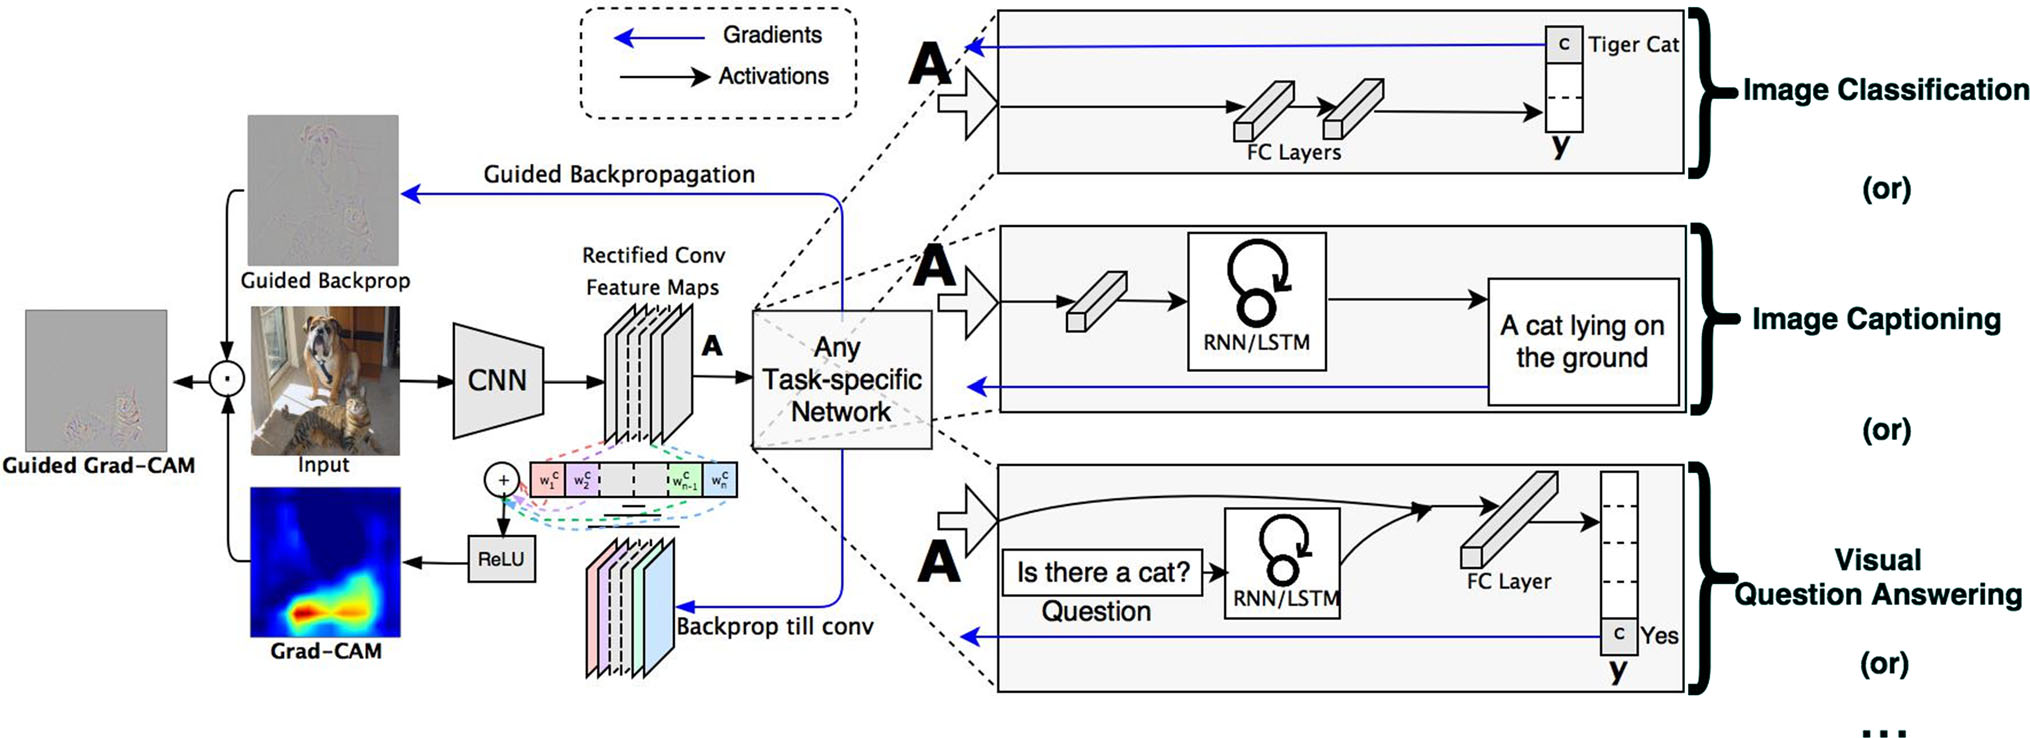
通过对卷积神经网络中各个特征层的特征内容来确定针对某个视觉任务,神经网络的关注点在哪个位置。然后通过热力图将其重要性展示出模型通过哪些像素点判断模型属于哪一个类别再用于后续的分析,同时也作为可解释性方向的一个重要组成,通过 Tensorflow 和 Pytorch 的例子来探索其具体的原理和实现方式。
Grad CAM
因为卷积层天然能够在任务中保持空间信息,经典的解释方案是采用反卷积(Deconvolution)和导向反向传播(Guided-Backpropgation)的方式实现的,CAM(Class Activation Mapping) 基于全局平均池化,后面每个特征都是各个全局平均池化提取出来的,针对第 \(k\) 个特征图的权重计算为
\begin{equation} \alpha^{c}_{k}=\frac{1}{Z}\sum_{i}\sum_{j}\frac{\partial y^{c}}{\partial A^{k}_{ij}} \end{equation}
- \(\alpha^{c}_{k}\): 特征图的像素个数
- \(y^{c}\): 第 c 类得分的梯度 (the gradient of the score for class c)
- \(A^{k}_{ij}\): 第 \(k\) 个特征图中,\((i,j)\) 位置处的像素值;
对于这些求到的特征图对应的类别分别加权求和即可得到最终的热力图(仅对应于某一个类别的热力图):
\begin{equation} L^{c}_{Grad-CAM} = \text{ReLU}(\sum_{k}\alpha^{c}_{k}A^{k}) \end{equation}

PyTorch 实现方式
通过 TorchRay 提供的函数接口可以以多种方式快速实现指定特征层的可视化。
from torchray.attribution.grad_cam import grad_cam
from torchray.benchmark import get_example_data, plot_example

# Obtain example data.
model, x, category_id, _ = get_example_data()

# Grad-CAM backprop.
saliency = grad_cam(model, x, category_id, saliency_layer='features.29')

# Plots.
plot_example(x, saliency, 'grad-cam backprop', category_id)
Tensorflow 的实现方式
Tensorflow 中的梯度是通过显示的方式实现求梯度值的,这一点
with tf.name_scope("GradCAM"):
    # 获取指定层的数据输出
    target_conv_layer = model.conv5
    # 求标签输出的置信度在当前这个特征输出上的代价
    cost = (-1) * tf.reduce_sum(tf.multiply(y,
                                            tf.nn.softmax(score)), axis=1)
    #
    y_c = tf.reduce_sum(tf.multiply(score, y), axis=1)
    print("y_c:", y_c)
    # 获得指定层的梯度
    target_conv_layer_grad = tf.gradients(y_c, target_conv_layer)[0]
    print("target_conv_layer_grad:", target_conv_layer)
    # 获得在指定输入上的梯度
    gb_grad = tf.gradients(cost, x)[0]
    print("gb_grad:", gb_grad)
开始会话获取实际的图中数据:
acc, y_np, y_c_np, gb_grad_value, target_conv_layer_value, target_conv_layer_grad_value = dann_sess.run([accuracy, y_op, y_c, gb_grad, target_conv_layer, target_conv_layer_grad], feed_dict={x: img_batch,
                                                                                                                                                                                              y: label_batch,
                                                                                                                                                                                              keep_prob: 1.})
获得梯度之后的绘制方式:
if epoch % 50 == 0:
    for i in range(batch_size):
        img = img_batch[i] + IMAGENET_MEAN
        # BGR -> RGB
        # img_bgr = img_centered[:, :, ::-1]
        output = target_conv_layer_value[i]  # [7,7,512]
        # print("output shape:", output.shape)
        # [7,7,512]
        grads_val = target_conv_layer_grad_value[i]
        weights = np.mean(grads_val,
                          axis=(0, 1))  # alpha_k, [512]
        cam = np.zeros(
            output.shape[0:2], dtype=np.float32)  # [7, 7]
        for j, w in enumerate(weights):
            cam += w * output[:, :, j]

        cam = np.maximum(cam, 0)
        cam = cam / np.max(cam)  # scale 0 to 1.0
        cam = resize(cam, (227, 227), preserve_range=True)
        cam_heatmap = cv2.applyColorMap(
            np.uint8(255*cam), cv2.COLORMAP_JET)
        heatmap_on_img = cam_heatmap * 0.9 + img
        heatmap_on_img = np.asarray(
            255 * heatmap_on_img / heatmap_on_img.max(), dtype=np.uint8)
        cv2.imwrite('{}/{}-{}-{}.png'.format(result_path, 'amazon',
                                              y_np[i], test_count * batch_size + i), heatmap_on_img)
Enjoy Reading This Article?
Here are some more articles you might like to read next: